|
Getting your Trinity Audio player ready... |
Understanding One-Way ANOVA: An Introduction
Analysis of Variance (ANOVA) is a statistical method widely used in various scientific disciplines, including clinical research, pharmacology, psychology, molecular medicine, and more. It helps in analyzing data to determine if there are statistically significant differences between the means of different groups based on a specific factor or treatment. This tool is crucial for experiments where multiple groups are tested under varying conditions to assess their outcomes.
In ANOVA, statistical significance is often represented with asterisks (*) in graphs, and researchers sometimes report the significance level (α) to indicate the threshold for rejecting the null hypothesis.
What is a Factor in ANOVA? Analysis of Variance (ANOVA)
A factor refers to an independent variable or treatment that can be controlled or manipulated in an experiment. This factor might influence the dependent variable, leading to differences in means between groups. Common examples of factors include:
- Temperature in chemical reactions.
- Solvent polarity in drug formulation studies.
- Diet or drug treatments in clinical trials.
One-Way ANOVA: A Closer Look
One-Way ANOVA analyzes the effect of a single factor on the dependent variable. It’s sometimes referred to as “unifactor ANOVA” or “single-factor ANOVA” when the experiment considers only one independent variable.
Hypotheses in One-Way ANOVA
In a one-way ANOVA, there are two hypotheses:
- Null Hypothesis (H₀): This hypothesis suggests that there is no difference in means due to the factor. Mathematically, this is expressed as:
μ1=μ2=μ3=⋯=μn\mu_1 = \mu_2 = \mu_3 = \dots = \mu_nwhere each μ\mu represents the mean of each group.
- Alternative Hypothesis (H₁): This hypothesis posits that there is a significant difference between at least some of the group means.
The calculation of the F-statistic is central to ANOVA. It is the ratio of the variance between group means to the variance within groups. A higher F-statistic indicates that the observed differences are unlikely to have occurred by chance, thereby providing stronger evidence against the null hypothesis.
Why Avoid Multiple T-Tests?
While the t-test is effective for comparing the means of two groups, it is not advisable to use multiple t-tests when comparing more than two groups. Conducting several t-tests increases the risk of making a Type I error—incorrectly rejecting the null hypothesis. ANOVA, on the other hand, maintains control over the overall error rate when comparing multiple groups.
What If There Are Multiple Factors?
In real-world research, experiments often involve more than one factor. For example:
- Biochemists may study the combined effects of stirring speed and temperature on a chemical reaction.
- Pharmacologists might explore how drug treatment and gender impact enzyme activity.
In these cases, a multifactor ANOVA (or multi-way ANOVA) is used. One common example is the Two-Way ANOVA, which considers two factors. Unfortunately, Excel supports only up to two-way ANOVA but can perform more advanced analyses with other tools like R, SPSS, or GraphPad Prism.
Performing One-Way ANOVA in Microsoft Excel
Though performing One-Way ANOVA by hand is possible, it’s time-consuming. Fortunately, Microsoft Excel offers an easy way to carry out ANOVA tests through its “Data Analysis” tool.
Steps to Perform One-Way ANOVA in Excel
To illustrate, let’s walk through a sample problem where a pharmacology research laboratory is testing the effects of four drug candidates on nitric oxide (NO) concentration in rat plasma. The researchers want to see if the treatments result in a significant change in NO concentration.
Step-by-Step Guide:
- Enable Data Analysis Tool:
If it’s not already enabled in Excel, go to File > Options > Add-ins > Excel Add-ins and check the Analysis ToolPak. - Enter Data into Excel:
Organize the data in columns with each group’s measurements listed under a heading. For example:Drug 1 Drug 2 Drug 3 Drug 4 12.1 15.3 10.2 9.7 13.5 14.9 11.4 10.3 11.8 14.2 12.5 9.9 … … … … - Run One-Way ANOVA:
- Go to the Data tab and select Data Analysis.
- Choose Anova: Single Factor and click OK.
- Select the input range (your data), exclude labels, and choose the output range for where the results should appear.
- Set Significance Level:
Set α = 0.05 to determine statistical significance. - Interpret the Results:
The ANOVA output will display various values like the F-statistic, p-value, and others. If the p-value is less than α (0.05), you reject the null hypothesis and conclude that there is a significant difference between group means.
Example:
For the data provided above, Excel returns a p-value of 0.00281, which is less than 0.05. This indicates that the drug treatments cause a statistically significant change in nitric oxide concentration.
Understanding Post-Hoc Tests
ANOVA is an omnibus test, meaning it tells you whether there is a difference between groups, but not where those differences lie. Post-hoc tests are performed after ANOVA to pinpoint which groups are different. Tests like Dunnett’s Test are often used to compare each treatment group to a control group.
Software like GraphPad PRISM and SPSS can also perform these post-hoc tests automatically.
Conclusion
One-Way ANOVA is a powerful tool for determining whether a factor significantly impacts a dependent variable across multiple groups. By using Microsoft Excel, performing ANOVA becomes a simple and efficient task, allowing researchers to interpret their data and make informed conclusions. However, when multiple factors are involved, or when deeper insights into the specific differences between groups are required, more advanced methods like multi-factor ANOVA and post-hoc tests should be considered.
References for Further Reading:
- Kim, H.-Y. “Analysis of Variance (ANOVA) Comparing Means of More than Two Groups.” Restorative Dentistry & Endodontics, 2014.
- Nayak, B., Hazra, A. “How to Choose the Right Statistical Test?” Indian Journal of Ophthalmology, 2011.
- Kao, L. S., Green, C. E. “Analysis of Variance: Is There a Difference in Means and What Does It Mean?” Journal of Surgical Research, 2008.
One-Way ANOVA Explained with Visuals
Example Scenario:
Let’s consider a pharmacology study testing four different drug candidates on the concentration of nitric oxide (NO) in rat plasma. The aim is to determine if the drug treatments result in significant changes in NO levels.
Step 1: Input Your Data
Here’s how you should organize your data in Excel:
| Drug 1 (µmol/L) | Drug 2 (µmol/L) | Drug 3 (µmol/L) | Drug 4 (µmol/L) |
|---|---|---|---|
| 12.1 | 15.3 | 10.2 | 9.7 |
| 13.5 | 14.9 | 11.4 | 10.3 |
| 11.8 | 14.2 | 12.5 | 9.9 |
| 12.0 | 14.5 | 12.8 | 9.5 |
| 13.2 | 15.0 | 11.7 | 9.8 |
Step 2: Perform One-Way ANOVA in Excel
- Enable Data Analysis Tool:
Go to File > Options > Add-ins > Excel Add-ins, check Analysis ToolPak, and press OK. - Run One-Way ANOVA:
- Select Data > Data Analysis.
- Choose Anova: Single Factor and click OK.
- Set your input range and output range, then select your significance level (α) as 0.05.
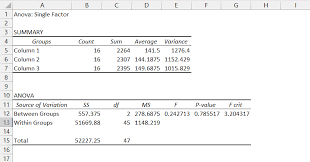
Step 3: ANOVA Output (Sample Result)
After running the test, Excel generates a table like this:
| Source | SS | df | MS | F | P-value | F crit |
|---|---|---|---|---|---|---|
| Between Groups | 35.88 | 3 | 11.96 | 7.55 | 0.00281 | 3.49 |
| Within Groups | 15.72 | 44 | 0.36 | |||
| Total | 51.60 | 47 |
- SS (Sum of Squares) represents the variability due to the factor and within groups.
- df (Degrees of Freedom) is the number of groups minus one for between groups, and the total number of observations minus the number of groups for within groups.
- MS (Mean Square) is the sum of squares divided by the degrees of freedom.
- F-statistic is the ratio of MS between groups to MS within groups.
- P-value tells you if the result is statistically significant.
- F crit (Critical F-value) is the threshold value for the F-statistic at a given significance level (α).
Step 4: Interpretation
Based on the output:
- The F-statistic is 7.55, which is much greater than the critical F-value of 3.49.
- The p-value is 0.00281, which is less than α = 0.05.
Thus, we reject the null hypothesis (H₀) and conclude that there is a statistically significant difference in NO concentrations between the drug treatments.
Visual Example: ANOVA Results (Bar Chart)
Here’s how the data might look in a simple bar chart to visualize the differences in means between the groups:
The chart would show the mean NO concentration for each drug group. Significant differences are typically marked with asterisks (*) or indicated on the graph.
Post-Hoc Testing: Where Are the Differences?
Once ANOVA tells us that there is a difference, we need to know which drug treatments are significantly different. This can be done using post-hoc tests like Dunnett’s Test or Tukey’s Test. These tests compare every group with every other group to pinpoint where the differences lie.
For example, if the p-value from a post-hoc test between Drug 1 and Drug 3 is 0.03 (less than 0.05), we can conclude that Drug 1 and Drug 3 produce statistically different NO levels.
Conclusion
One-Way ANOVA is a useful method to determine whether a factor influences a dependent variable across multiple groups. By using tools like Microsoft Excel, the process is simplified, and you can quickly interpret your results.
- Key Steps:
- Organize data.
- Run ANOVA using the “Data Analysis” tool.
- Analyze the results (F-statistic, p-value).
- If significant, perform post-hoc tests to identify differences between groups.